December 14,2015 – Understanding how to calculate OEE (Overall Equipment Effectiveness) as a key metric of your manufacturing process
OEE (Overall Equipment Effectiveness) is a top view metric indicating the gap between the initial and improved performance of a manufacturing unit. It categorizes major reasons for poor performance of equipment, providing the basis for further analysis and improvement in a production process.
OEE, defined as a measure of overall equipment performance, identifies six major losses for ineffective performance of a production line based on its Availability, Performance and the Quality rate of the output.
- The Availability of equipment is affected by downtime losses including equipment failure and process failure.
- The Performance efficiency of equipment is affected by speed losses including idling minor stops and reduced speed.
- The Quality rate of equipment is directly affected by defect losses including defects in process and reduced yield.
The factors of six major losses and the structure of OEE are shown below: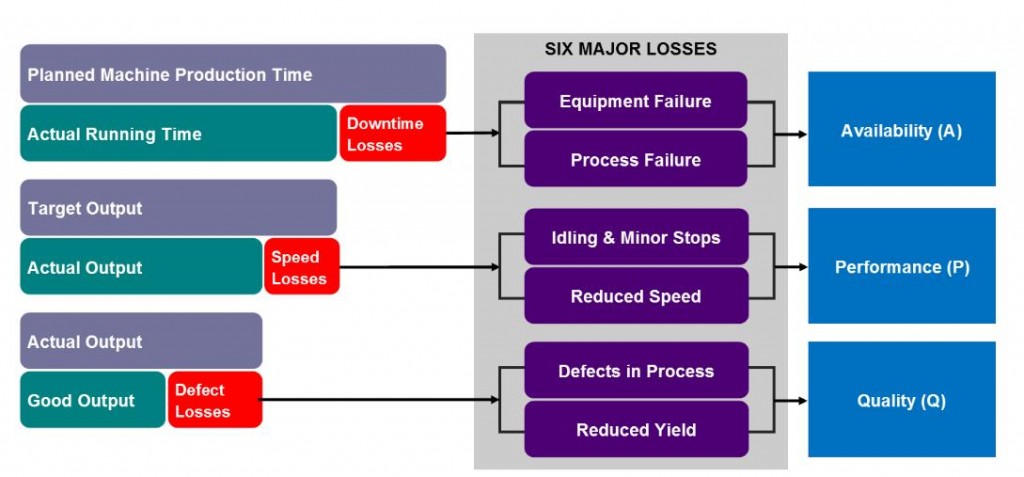
So how do you go about defining a measurement for OEE?
One suggestion is to create a database where an operator inputs the boards produced per hour into an Excel spreadsheet. If they can’t reach the “standard” number of boards set per hour, they would input a downtime issue and assign it to a specific category and subcategory (i.e. damaged feeder). Calculations examples are as follows:
Net time = total time – planned downtime
Total Available time = net time – unplanned downtime
Availability = (total available time)/net time *100%
Let’s say that you have 150 minutes of net time,30 minutes of downtime because of a damaged feeder, and 20 minutes of setup between product A and B. So, your total available time will be = 150 – (30+20) = 100 minutes.
Availability = 100 / 150 * 100% = 66.66%
For line performance, you need to consider the total available time since you can’t count time that line was down… it is basically how good (or bad) the line ran when it was available for production.
Total produced time = Sum(Pc/Rate)
Example: RateA = 100 pc/hr rateB = 140 pc/hr
Pc produced ProductA = 150 pc ProductB = 15 pc
Total produced time = (150/100 + 15/140)pc/(pc/hr)*60 min/hr = 96.43 min
Total available time = 100 min
Performance = 96.43 / 115 * 100 = 83.85 %
Quality rate is basically good pieces against total produced.
Let’s say you have 165 boards produced and 3 went to repair so you have a Quality rate of = 163/165 * 100% = 98.78%
Based on this your Overall Equipment Effectiveness (OEE) rate is: OEE = (0.6666*0.8385*0.9878) * 100% = 55.21%
Based on the above, if you graphed the indexes (managers love that) you will see that you have to improve your availability, and you need to improve your machinery (feeders) and changeover strategy.
So now that you know how to calculate your OEE, and you know you need to improve your changeover strategy, how do you go about doing that?
Stay tuned for Part 3 of our blog where we talk about ways to improve changeover strategy.